
02Site screen
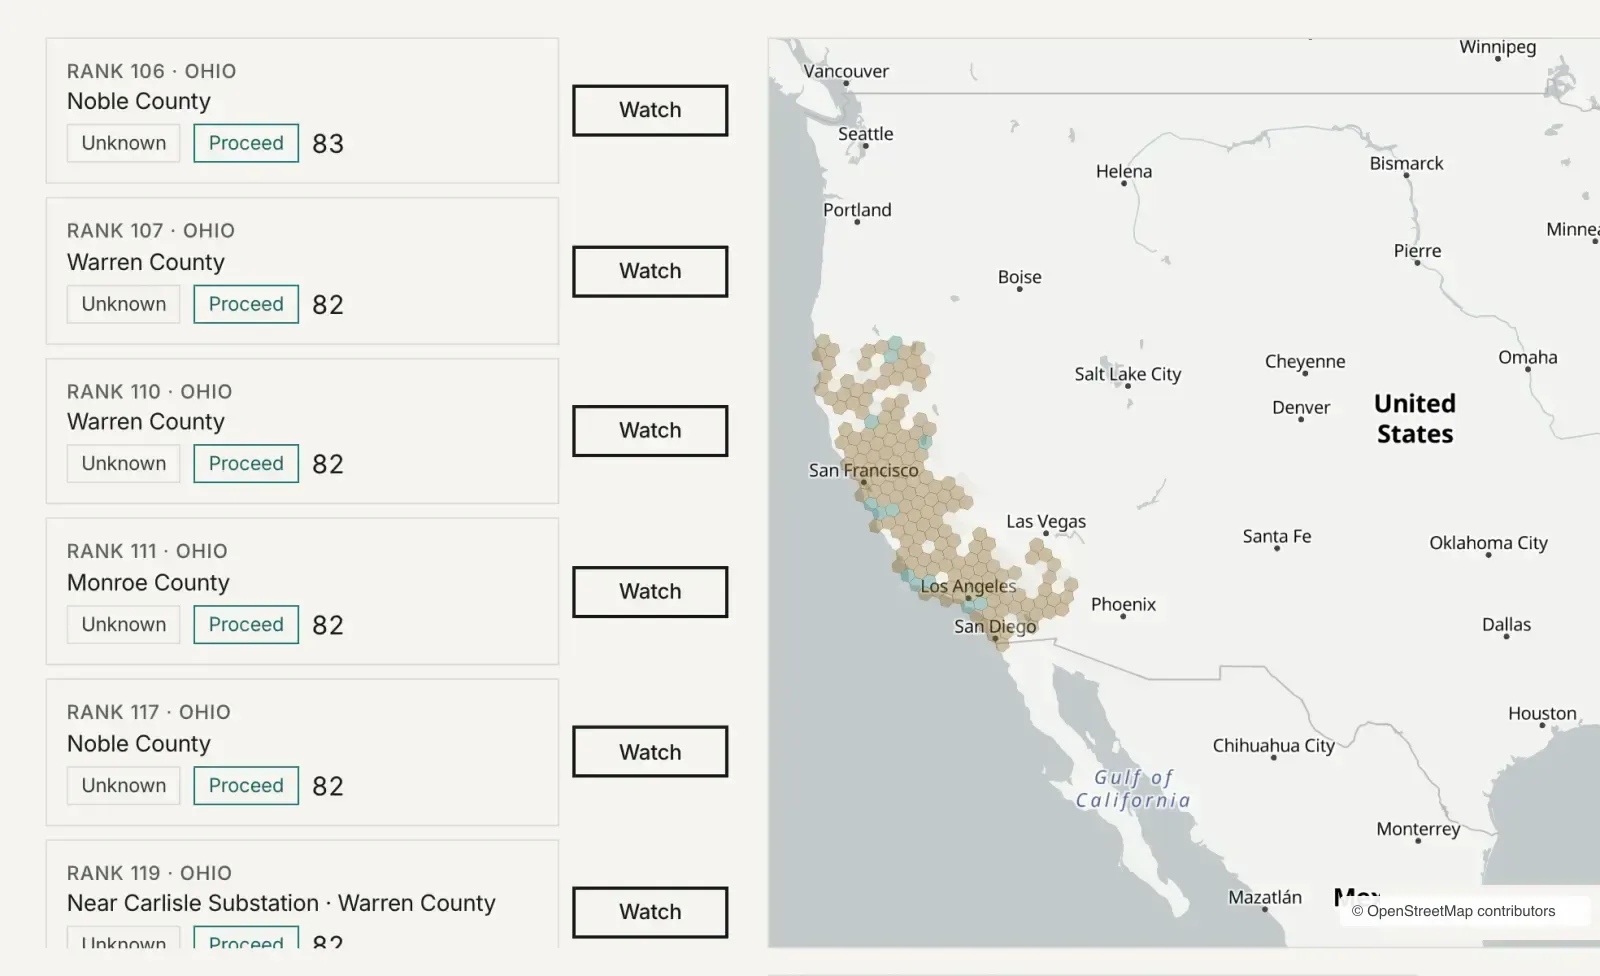
Every 5 km² scored for power.
Each hexagon in a US state or UK region is scored on grid distance, headroom, queue, retiring plant, gas, land and price. Every factor carries its date. A live moratorium caps the score.
The market brain behind our sites. Map layers, site screens, time to power, risk and project odds, each figure with its date.
Sign in with your existing Microsoft or Google account. Access is by invitation.
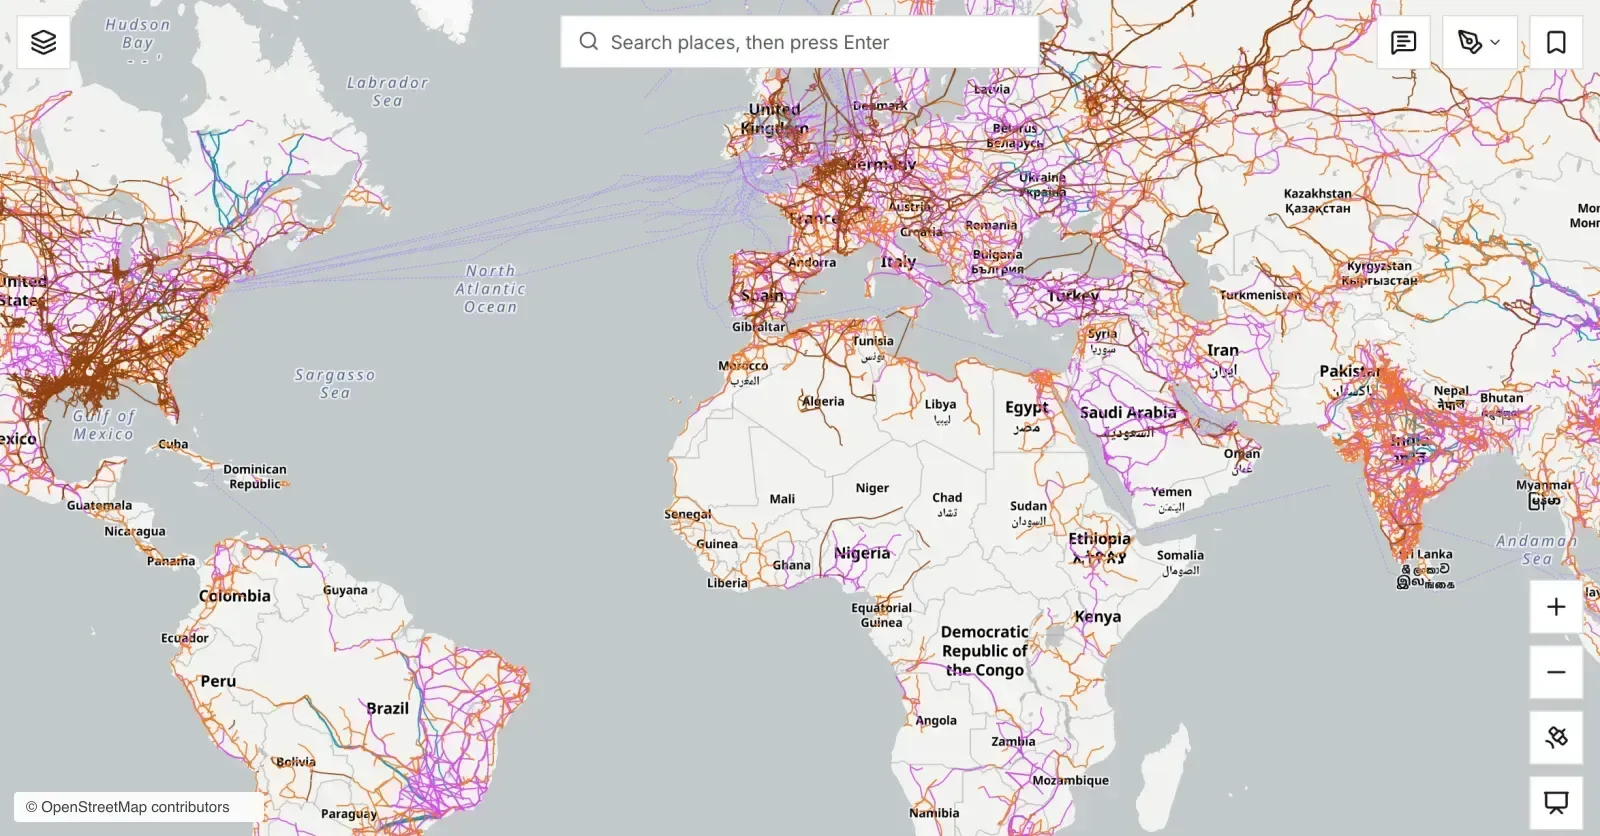
Every number carries its date and how it was checked. Where data runs out, the screen says so.
Agents read the registers, filings and news every day and draft decision cards. A person makes every call.
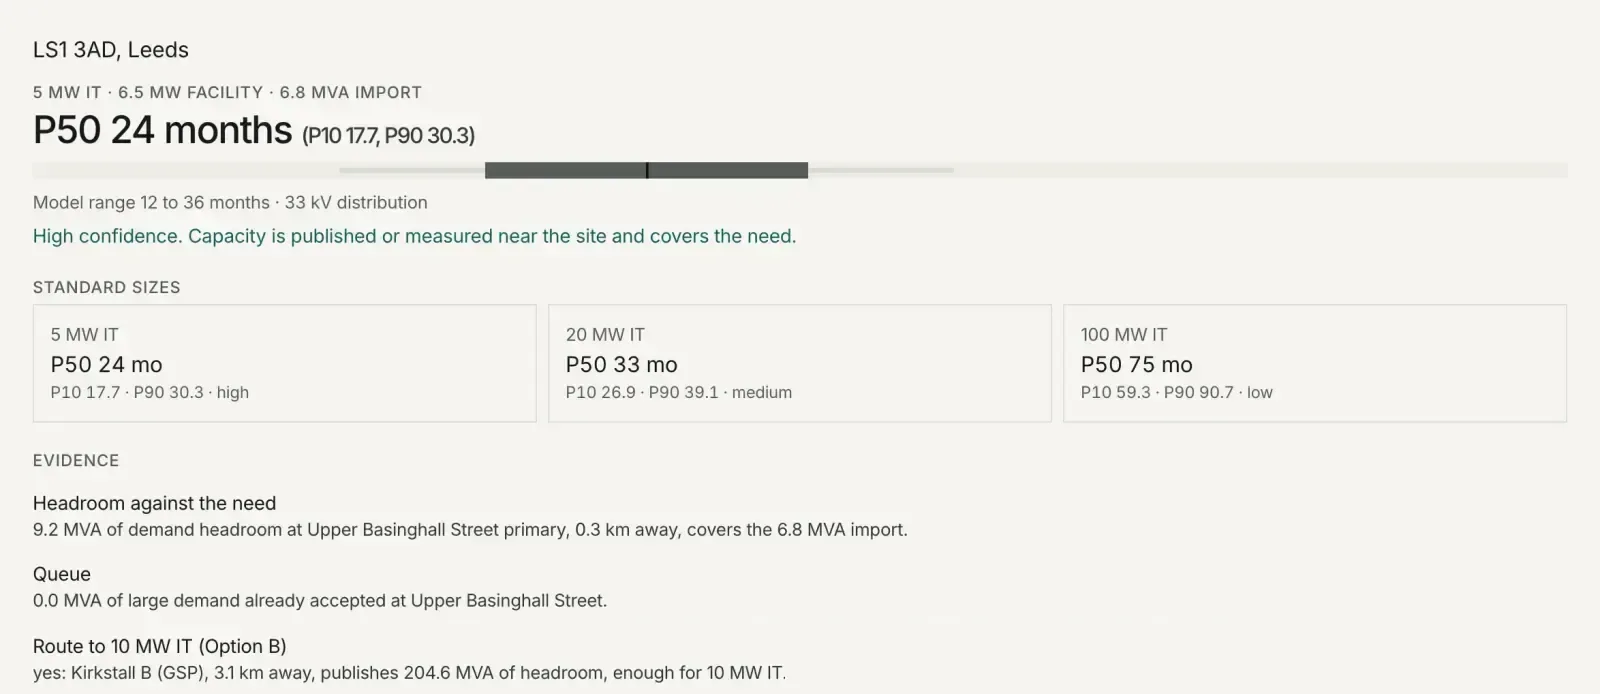
Time to power is P10, P50 and P90 with a confidence level. Odds come with their reasons.
Turn a site, a market or a project into a short, dated memo when you need one.
02Site screen
Each hexagon in a US state or UK region is scored on grid distance, headroom, queue, retiring plant, gas, land and price. Every factor carries its date. A live moratorium caps the score.
03Time to power
Months to energise 1 to 100 MW anywhere in the US or Great Britain. You get P10, P50 and P90 with a confidence level, the evidence behind each step, and a back-test against real projects.
04Risk radar
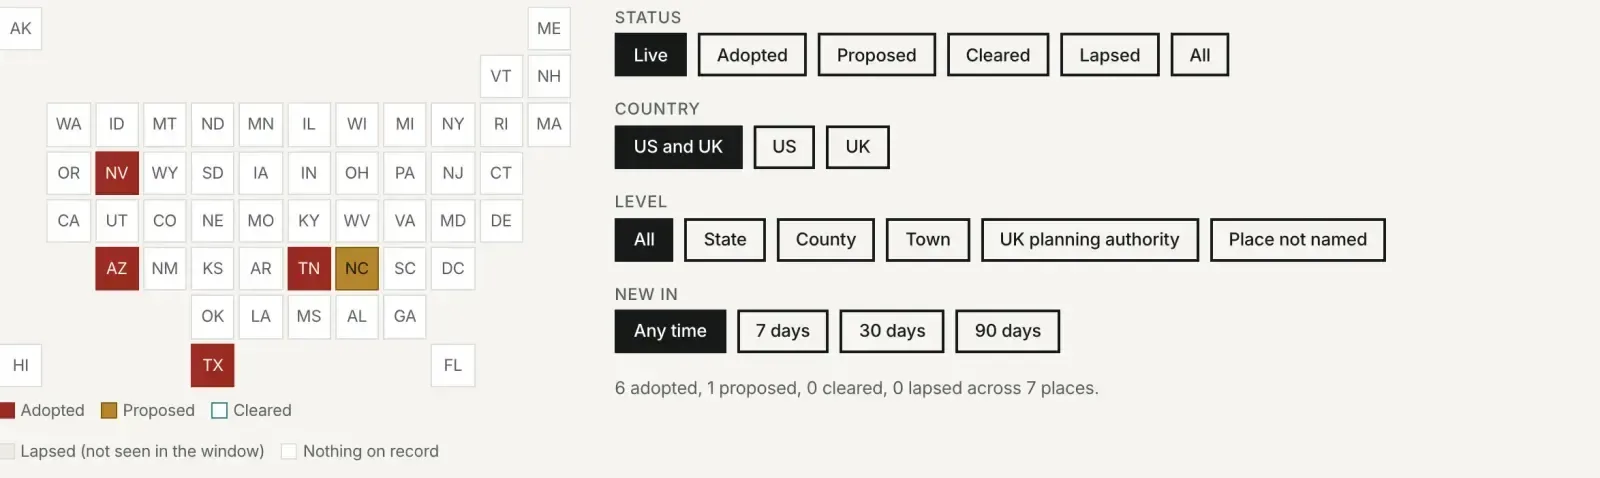
Data-centre moratoria and large-load rules by state, county and planning authority, with trend and dates. When a news source degrades, the radar says so instead of going quiet.
05Project odds
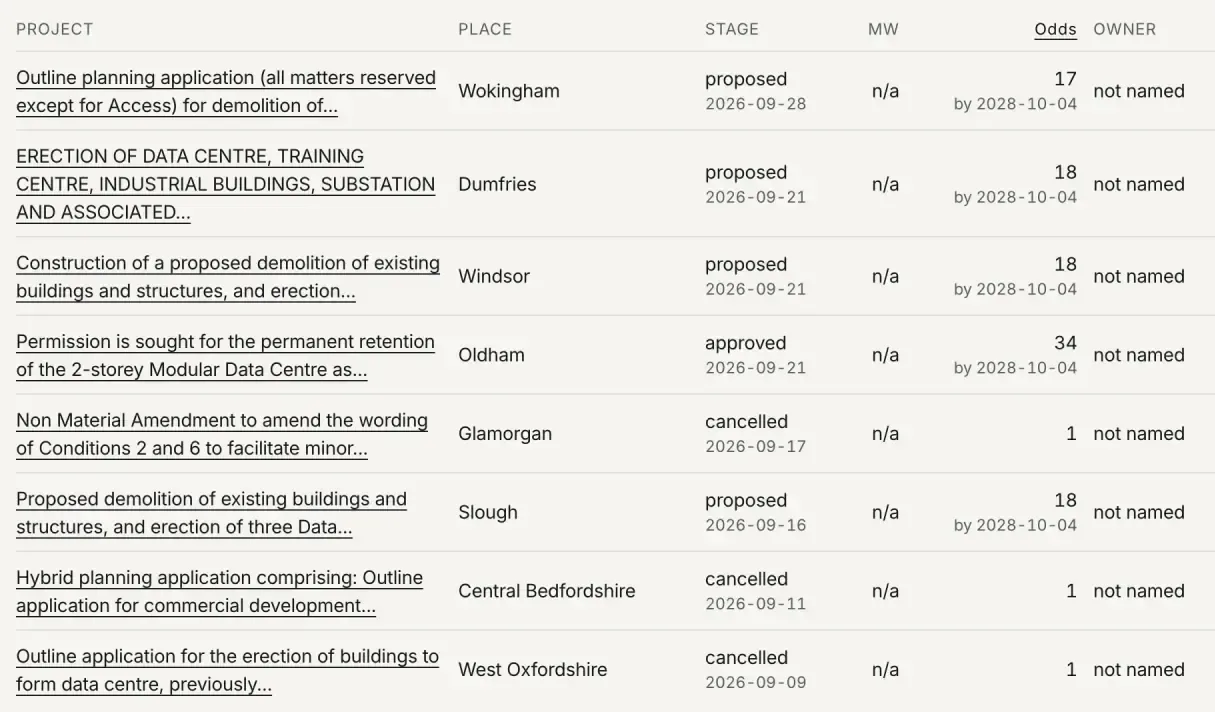
Every tracked data-centre project in the US and Great Britain, from announced to operational, with a 0 to 100 energisation probability. Each row shows its stage and date. The weights are working assumptions, and we say so.
Intelligence is for PowerFirst founders, partners and invited teams. Tell us what you are working on and we will set up access.